Quadratic function and its graph
A quadratic function is a polynomial function of degree two. It is defined by the formula: , where , and are constants, and a is not equal to zero.
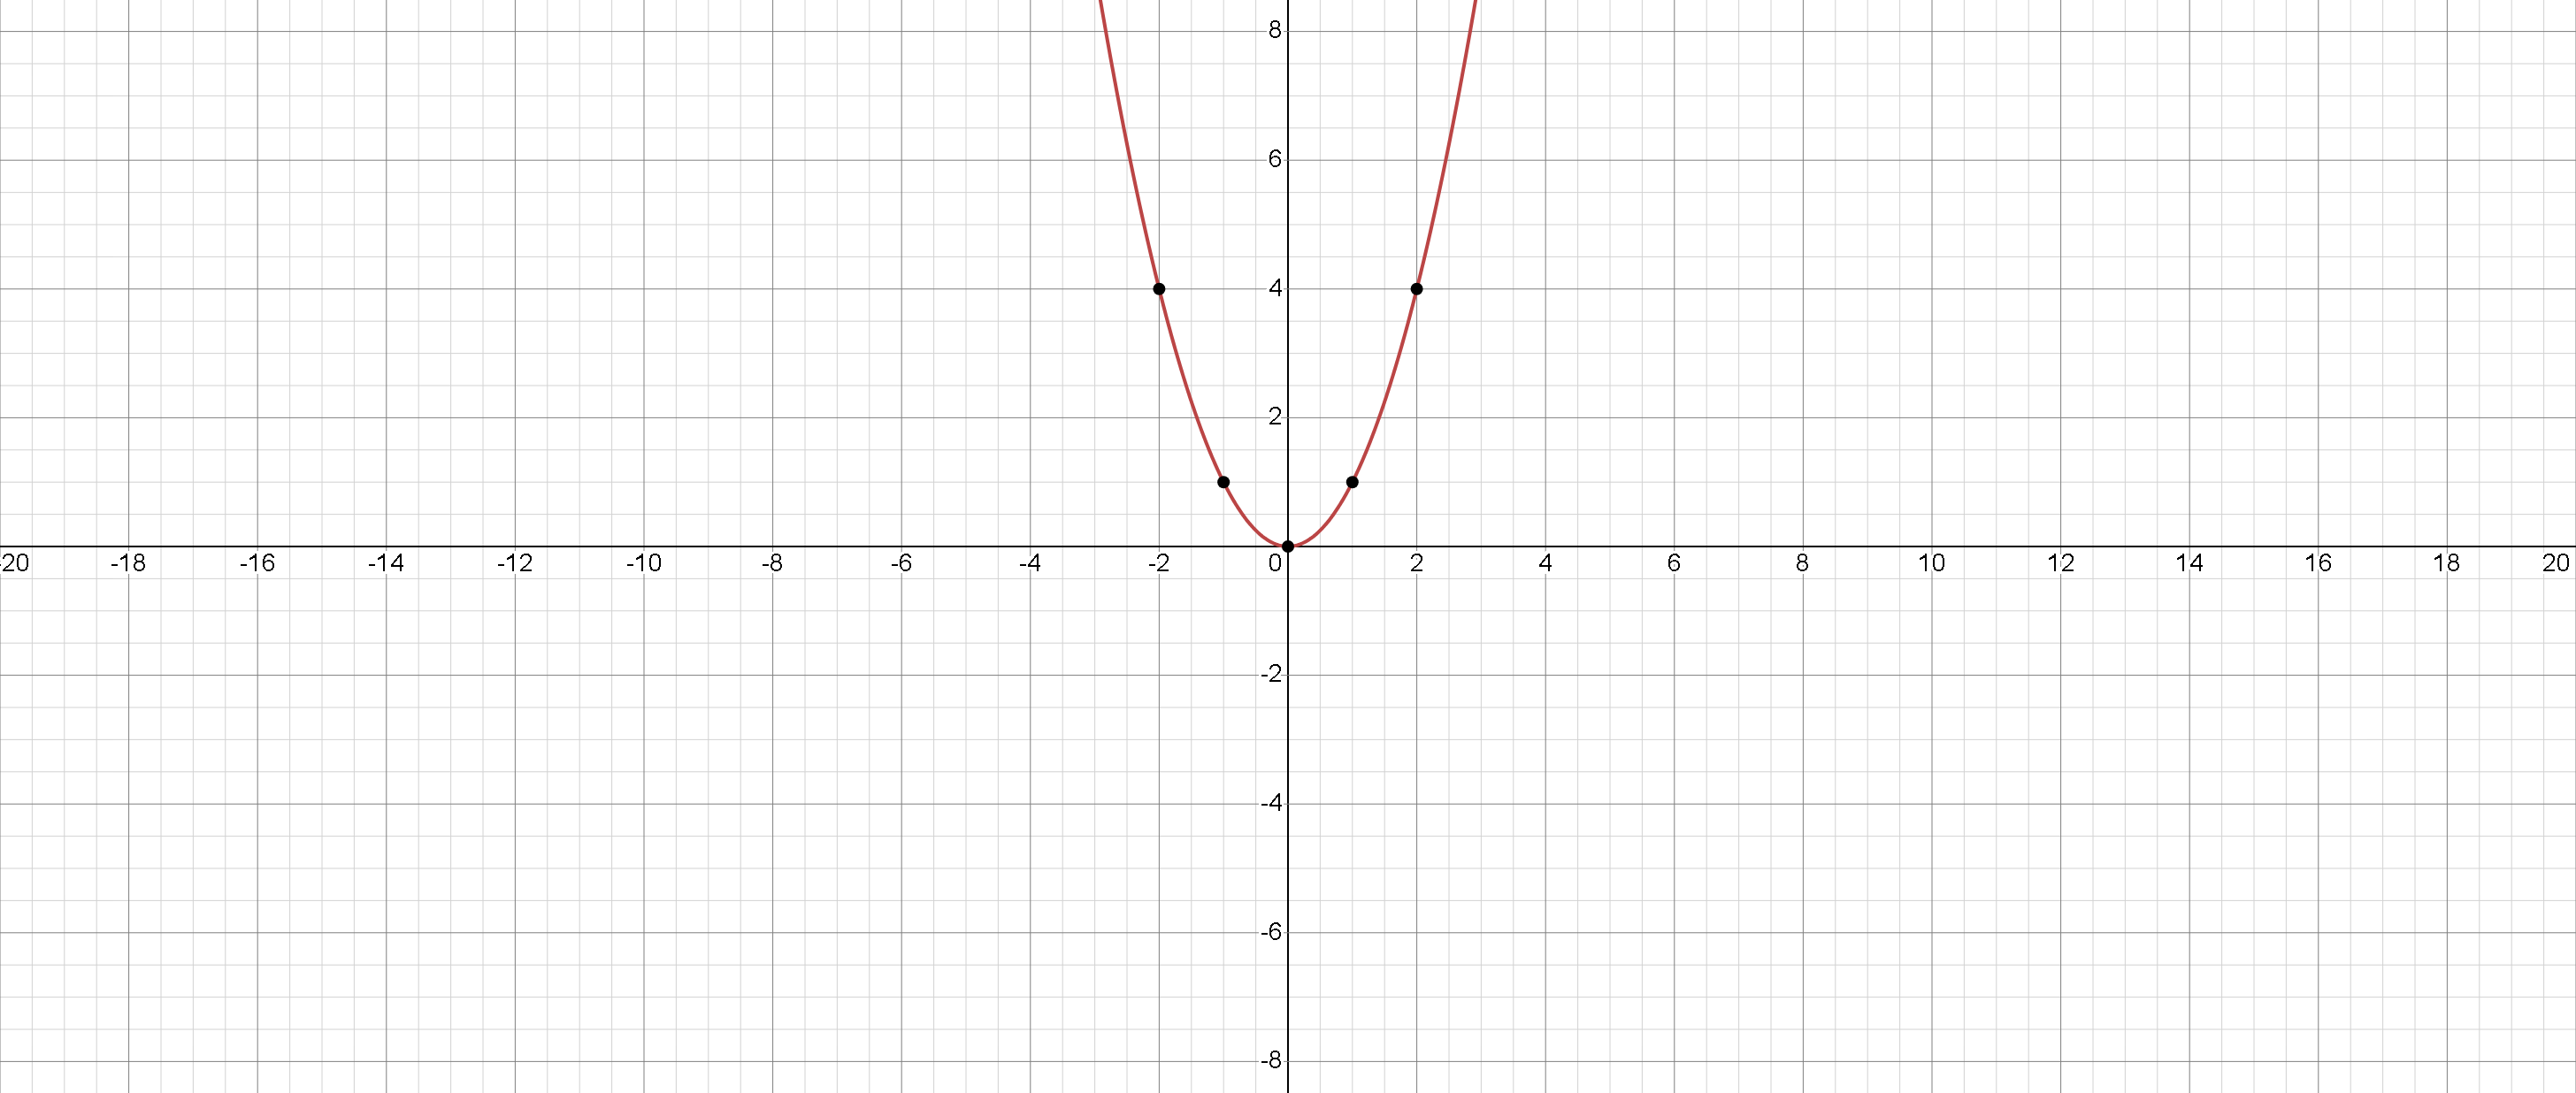
The graph of a quadratic function is a parabola, which is a U-shaped curve. The direction of the parabola depends on the sign of the leading coefficient . If is positive, the parabola opens upward, and if is negative, the parabola opens downward.
The vertex of the parabola is given by the formula: .
The axis of symmetry of the parabola is the vertical line passing through the vertex, given by the equation
The -intercepts (zeros) of the quadratic function are given by the quadratic formula: .
If the discriminant is positive, the quadratic function has two distinct real roots, which are the -coordinates of the -intercepts. If the discriminant is zero, the quadratic function has one real root, which is the -coordinate of the vertex. If the discriminant is negative, the quadratic function has no real roots, but two complex
conjugate roots.
Quadratic functions can also be written in factored form: , where and are the roots of the quadratic function. This form is useful for finding the roots of the function.
The vertex form of the quadratic function is: , where is the vertex of the parabola. The standard form and vertex form of the quadratic function are related by: , which shows that , , and are related to the vertex .
The quadratic function can be graphed by plotting the vertex, the axis of symmetry, and the -intercepts. To sketch the graph, we can also find the maximum or minimum value of the function, the domain, the range, and any transformations or shifts.
Maximum or minimum value
of the quadratic function:
If , the parabola opens upward, and the vertex is the minimum point of the function. The minimum value is . If , the parabola opens downward, and the vertex is the maximum point of the function. The maximum value is .
Domain and range
of the quadratic function:
The domain of the quadratic function is the set of all real numbers, since the function is defined for all values of . The range depends on the sign of the leading coefficient . If , the range is and if , the range is .
Graph:
The graph of a quadratic function can be transformed by changing the values of , and . For example, if is multiplied by positive constant, the graph is stretched vertically, and if is multiplied by a negative constant, the graph is reflected about the -axis. If is added to or subtracted from , the graph is shifted
horizontally and if is added to or subtracted from , the graph is shifted vertically.
Absolute Value (y=|x|) function and its graph
The function is a piecewise-defined function that takes the absolute value of the input . The absolute value function is defined as follows:
Therefore, the function takes the value when is non-negative, and when is negative. The graph of is a V-shaped curve with the vertex at the origin. The slope of the curve changes at , where the function is not differentiable.
Here are some important properties of the absolute value function:
Symmetry:
The function is symmetric about the origin, which means that for all .
Non-negative values:
The absolute value of any real number is non-negative, which means that for all .
Distance:
The absolute value of a number represents its distance from zero on the number line. For example, and .
Piecewise-defined function:
The absolute value function is a piecewise-defined function, which means that it is defined differently for different intervals of the input . In particular, when and when .
Applications:
The absolute value function is used in a variety of applications, such as measuring the difference between two values, calculating distances, and solving absolute value equations.
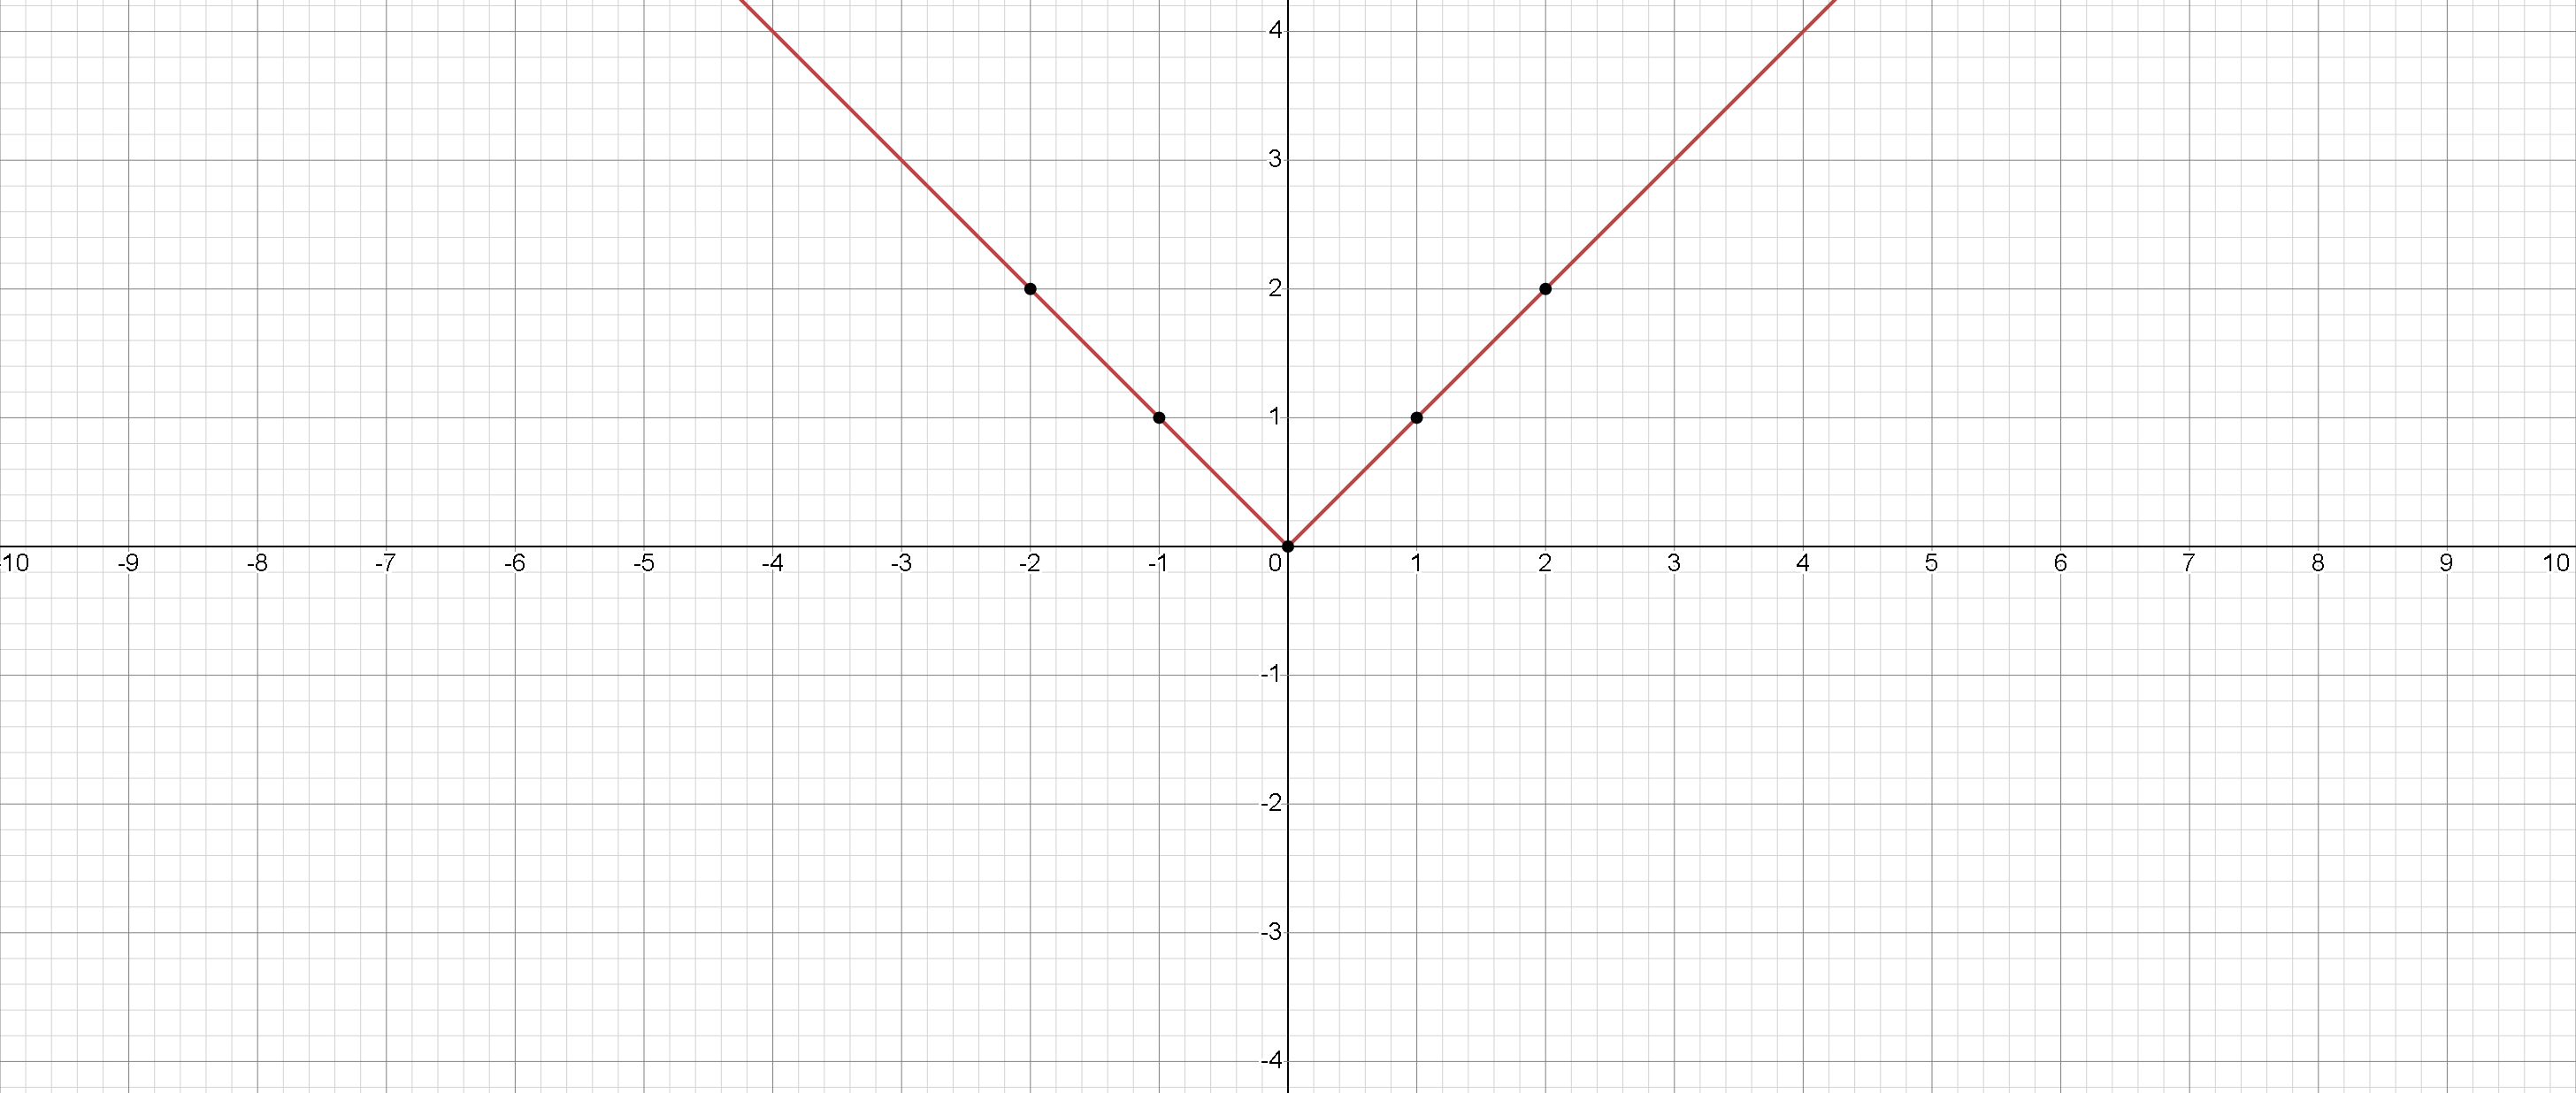
To summarize, the absolute value function is a piecewise-defined function that takes the non-negative value of its input if it is non-negative, and the negative of its input if it is negative. The graph of is a V-shaped curve that is symmetric about the origin.
Cubic function and its graph
The function is a cubic function that takes the input x and raises it to the third power. The graph of is a curve that passes through the origin and has a shape similar to the letter "S". The function is defined for all real values of .
Here are some important properties of the cubic function:
Domain and range:
The domain of the function is all real numbers, which means that any real number can be plugged into the function. The range of the function is also all real numbers, which means that the output can take any real value.
Symmetry:
The function is an odd function, which means that for all . This property results in the graph of the function being symmetric about the origin.
Intercepts:
The function passes through the origin, which means that it has a -intercept of zero. The function does not have any -intercepts.
Increasing and decreasing intervals:
The function is increasing for all , which means that the value of the function increases as increases. This property results in the graph of the function being upward-sloping. The function does not have any local maxima or minima.
Applications:
The cubic function is used in a variety of applications, such as modeling the volume of a cube or the growth of a population.
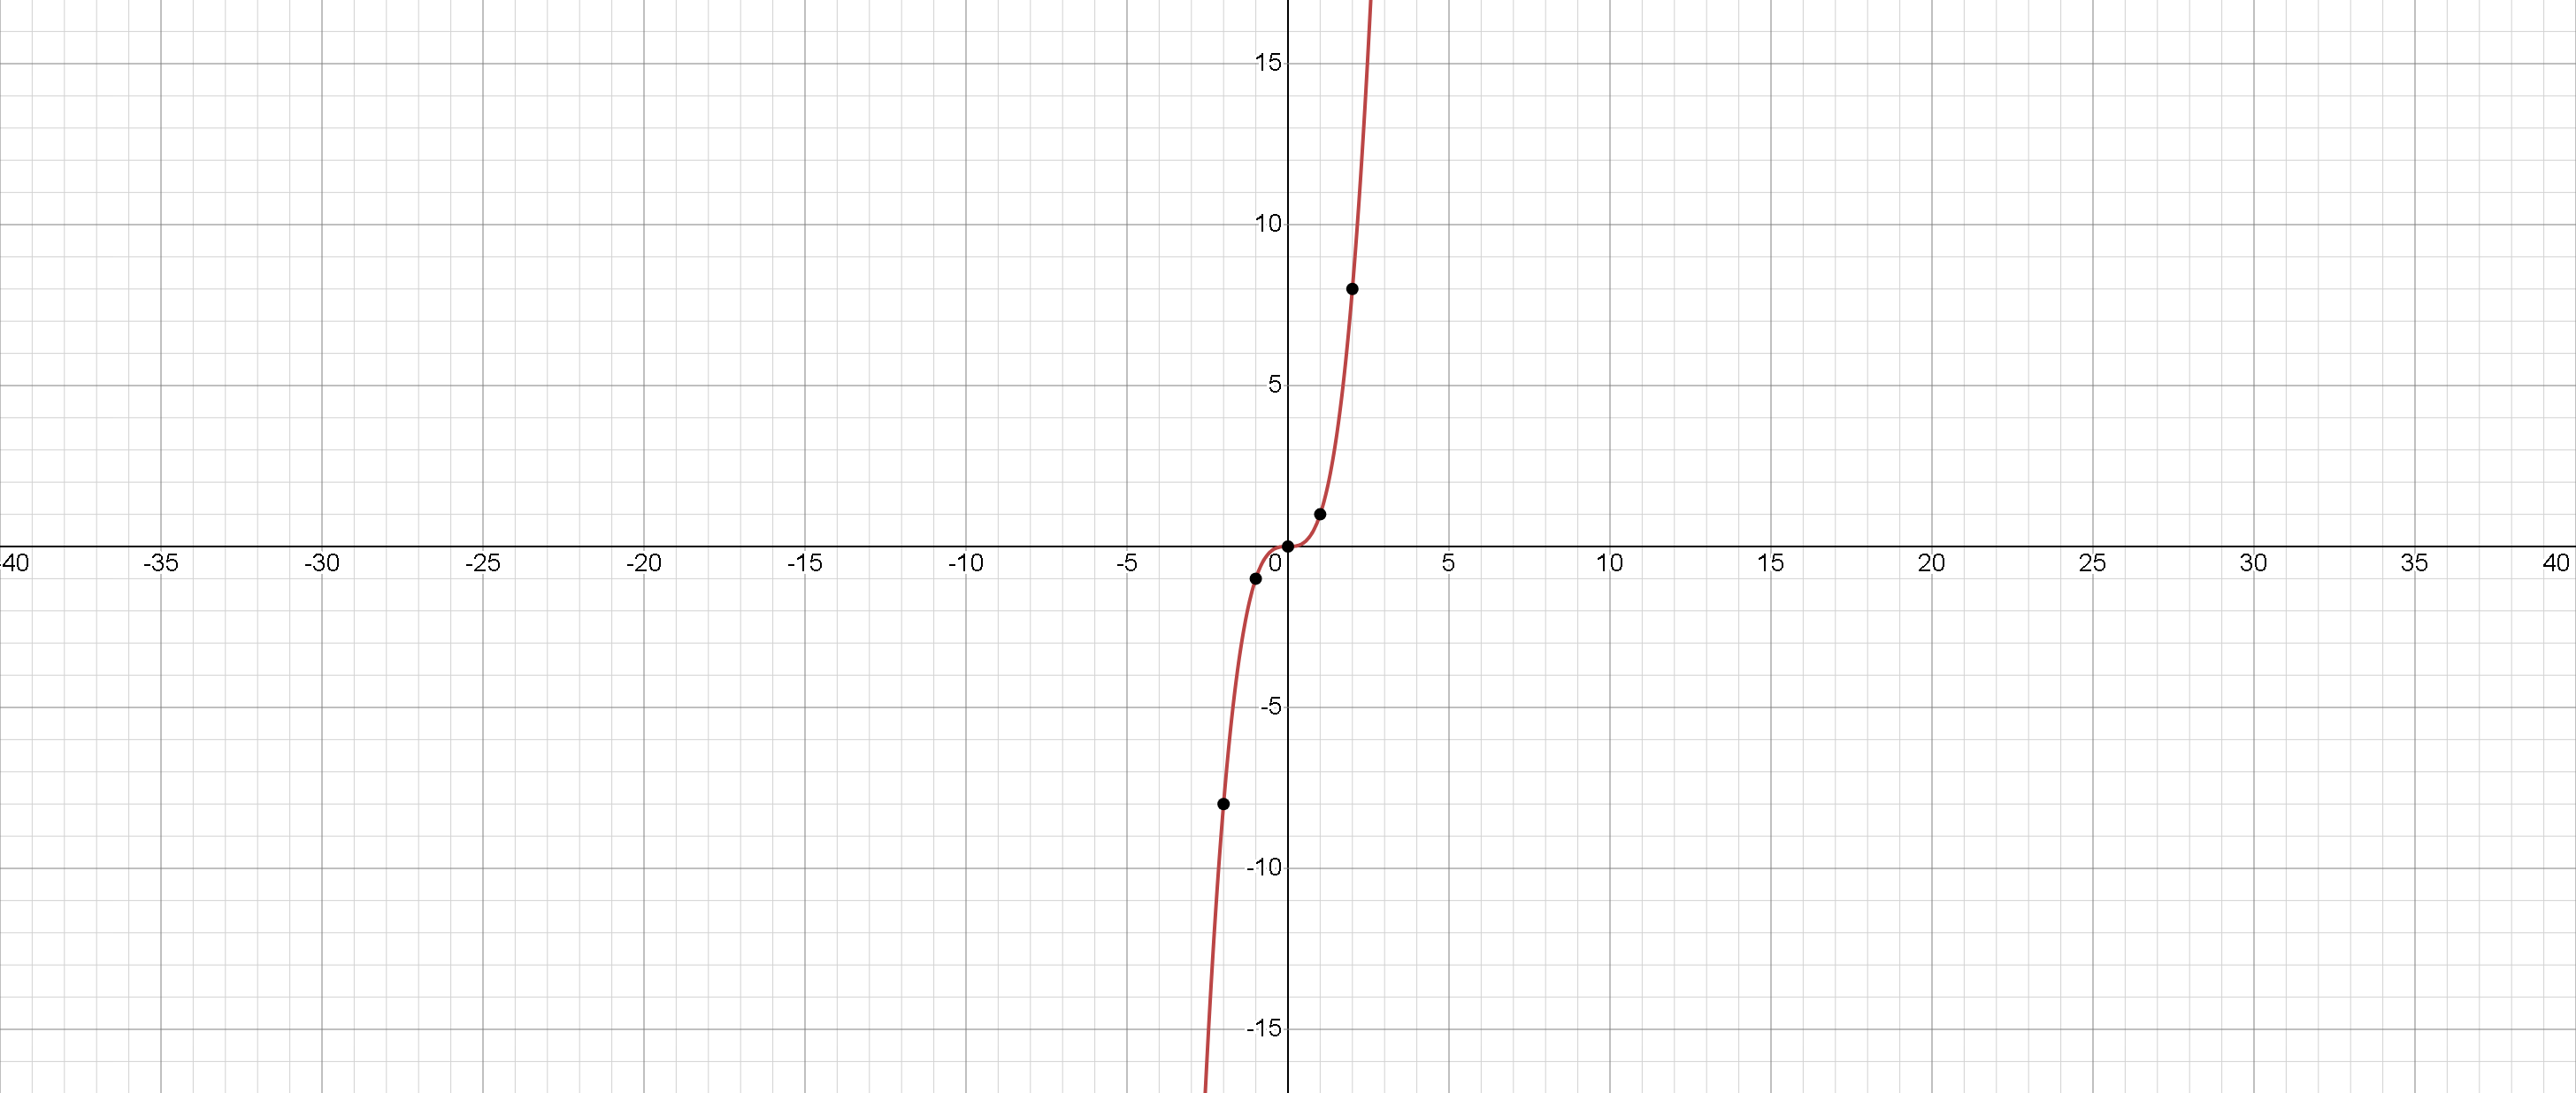
To summarize, the cubic function is a function that raises the input to the third power. The graph of the function is an upward-sloping curve that passes through the origin and is symmetric about the origin. The function is defined for all real values of and has a range of all real numbers.